Multiple Choice
Refer to the following graph to answer the following questions: 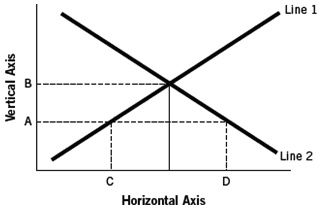
-Assuming the figure represents the market for loanable funds,and that point C represents 40 and point D represents 80,then it would be true that
A) both points represent interest rates and there is a surplus of loanable funds at an 80 percent interest rate.
B) both points represent interest rates and there is a shortage of loanable funds at an 80 percent interest rate.
C) both points represent the quantity of loanable funds and there would be a surplus of loanable funds of 40 units.
D) both points represent the quantity of loanable funds and at interest rate A there would be a shortage of loanable funds of 40 units.
E) the quantity of loanable funds supplied exceeds the quantity demanded at interest rate B,if B represents an interest rate.
Correct Answer:

Verified
Correct Answer:
Verified
Q77: Which combination of events could have caused
Q78: If foreign income and wealth decrease,this would
Q79: The gap between the real and nominal
Q80: What is meant by the savings rate,and
Q81: If real rates were higher than nominal
Q83: The fact that people prefer to receive
Q84: In the 1960s,President Kennedy advocated an "investment
Q85: If time preferences increase,<br>A) the demand for
Q86: You borrow $10,000 today at a nominal
Q87: What would be an example of increased