Multiple Choice
Consider the following data that gives the quantity produced and unit price for three different goods across two different years to answer the following questions. Assume that the base year is 2015. 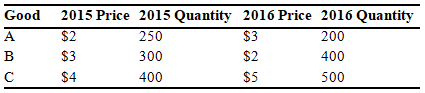
-What was the inflation rate between the two years?
A) 1 percent
B) 3.2 percent
C) 2 percent
D) 3.8 percent
E) 8.3 percent
Correct Answer:

Verified
Correct Answer:
Verified
Q63: Net exports can be defined as<br>A) exports
Q64: If real gross domestic product (GDP)grew by
Q65: Explain why it is reasonable to count
Q66: If gross domestic product (GDP)is supposed to
Q67: Draw a graph to illustrate the phases
Q69: Which of the following is a service?<br>A)
Q70: Consider the following data that gives the
Q71: You bought stock in 2010 for $100
Q72: When George buys a new computer for
Q73: For the following questions, suppose a country