Multiple Choice
Consider the actual and forecast values contained in the table. 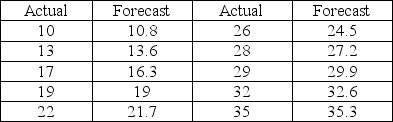 What is the MAPE of the forecast?
A) 2.92%
B) 3.08%
C) 3.17%
D) 3.26%
Correct Answer:

Verified
Correct Answer:
Verified
Related Questions
Q102: Consider the actual and forecast values contained
Q103: The following table shows the number of
Q104: In general terms, describe what qualitative forecasting
Q105: Which of the following is a technique
Q106: Which of the following methods tells whether
Q108: Daily high temperatures in the city of
Q109: The process of isolating linear trend and
Q110: State the mathematical expression for exponential smoothing.
Q111: Which of the following methods produces a
Q112: A scatter diagram for a time series