Multiple Choice
Demand for Y is shown in the table. 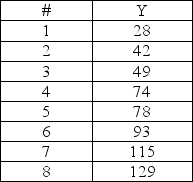 Develop a forecast using a trend line.What is the forecast for period 10?
A) 151.7
B) 153.9
C) 155.1
D) 157.3
Correct Answer:

Verified
Correct Answer:
Verified
Related Questions
Q57: Time series models extrapolate historical data from
Q58: Calculate (a)MAD, (b)MSE, and (c)MAPE for the
Q59: Describe the naïve forecasting method.
Q60: Demand for Y is shown in the
Q61: Explain, briefly, why the larger the number
Q63: Four components of time series are trend,
Q64: Explain, briefly, why most forecasting error measures
Q65: Time series models enable the forecaster to
Q66: Given the following gasoline data:<br> <img src="https://d2lvgg3v3hfg70.cloudfront.net/TB5481/.jpg"
Q67: Which of the following is not considered