Multiple Choice
The following table shows the number of pies consumed by the deans' suite during a monthly pie-eating contest. 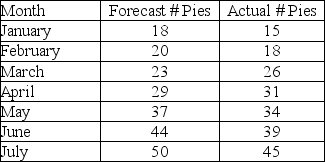 What is the forecast bias?
A) -1.86
B) -1.04
C) 1.04
D) 1.86
Correct Answer:

Verified
Correct Answer:
Verified
Related Questions
Q28: What is the basic additive decomposition model
Q29: Sales for boxes of Girl Scout cookies
Q30: Demand for Y is shown in the
Q31: In general terms, describe what TIME SERIES
Q32: Daily humidity in the city of Houston
Q34: One MAD is equivalent to approximately<br>A)0.8.<br>B)1.2.<br>C)1.6.<br>D)2.0.
Q35: Demand for Y is shown in the
Q36: Enrollment in a particular class for the
Q37: The exponential smoothing with trend model uses
Q38: Multiple regression may be used to forecast