Essay
For the data below:
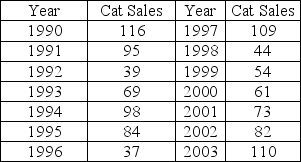 (a)Develop a scatter diagram.
(b)Develop a five-year moving average forecast.
(c)Find MAPE.
Correct Answer:

Verified
(a)scatter...View Answer
Unlock this answer now
Get Access to more Verified Answers free of charge
Correct Answer:
Verified
(a)scatter...
View Answer
Unlock this answer now
Get Access to more Verified Answers free of charge
Related Questions
Q50: Daily demand for newspapers for the last
Q51: In picking the smoothing constant for an
Q52: Briefly describe why the scatter diagram is
Q53: In a weighted moving average, the weights
Q54: Average starting salaries for students using a
Q56: Deseasonalized data can be modeled as a
Q57: Time series models extrapolate historical data from
Q58: Calculate (a)MAD, (b)MSE, and (c)MAPE for the
Q59: Describe the naïve forecasting method.
Q60: Demand for Y is shown in the