True/False
The following figure illustrates a utility curve for someone who is a risk seeker. 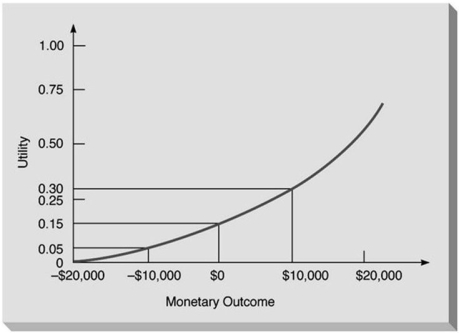
Correct Answer:

Verified
Correct Answer:
Verified
Related Questions
Q108: A manager needs to hire short-term employees
Q109: David S Pumpkins is planning to open
Q110: The decision making criterion of realism only
Q111: Consider the following payoff table. <img src="https://d2lvgg3v3hfg70.cloudfront.net/TB5481/.jpg"
Q112: The decision theory processes of maximizing expected
Q114: The following is a payoff table giving
Q115: A decision maker is faced with a
Q116: Which of the following is not one
Q117: Mark M.Upp has just been fired as
Q118: The maximax decision criterion is used by