Multiple Choice
Table 15-1
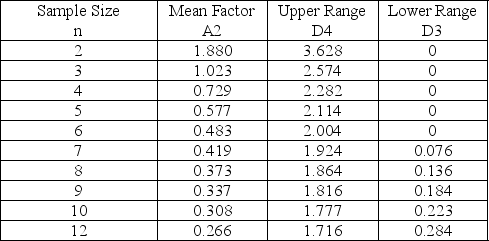
-Refer to Table 15-1.To guarantee that cans of soda are properly filled, some cans are sampled and the amounts measured.The overall average for the samples is 12 ounces.Each sample contains 10 cans.The average range is 0.4 ounces.The lower control chart limit for the sample averages would be
A) 12.1232.
B) 11.8768.
C) 13.2.
D) 12.308.
Correct Answer:

Verified
Correct Answer:
Verified
Q34: Table 15-1<br> <img src="https://d2lvgg3v3hfg70.cloudfront.net/TB5481/.jpg" alt="Table 15-1
Q35: A p-chart has been developed for a
Q36: A p-chart is based on which of
Q37: Explain the difference between a p-chart and
Q38: A run of four consecutive points above
Q40: A c-chart would be appropriate to monitor
Q41: Defects in computer hard-drives will usually render
Q42: A company has been receiving complaints about
Q43: An x-bar chart would be appropriate to
Q44: P-charts and c-charts are examples of control