Multiple Choice
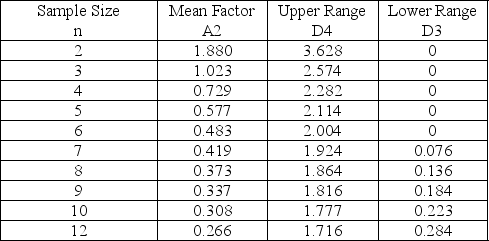
Table 15-1

-Refer to Table 15-1.The average range of a process for packaging cereal is 1.1 ounces.If the sample size is 10, find the upper control chart limit for the range chart.
A) 0.245
B) 1.955
C) 1.777
D) 0.223
Correct Answer:

Verified
Correct Answer:
Verified
Related Questions
Q7: For data that are appropriately handled by
Q8: It is impossible to develop a process
Q9: Explain the difference between control charts for
Q10: When receiving a shipment from a supplier,
Q11: Which of these patterns on a control
Q13: Technically, to achieve Six Sigma quality, there
Q14: The underlying distribution for a p-chart is
Q15: Joe studied his control chart and noticed
Q16: C-charts are used to analyze the proportion
Q17: TQM emphasizes quality of the goods or