Essay
Table 15-1
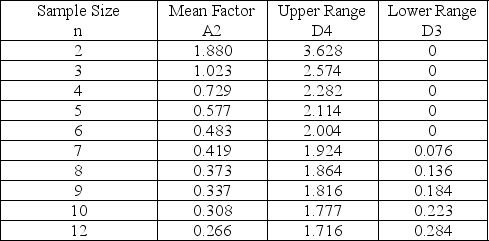
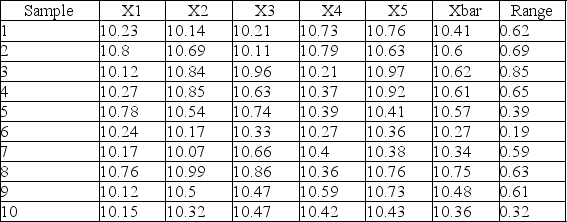
-Use the data shown below and the information in Table 15-1 to develop a control chart that monitors central tendency.Use your chart to make an assessment - is the process in control?
Correct Answer:

Verified
Xbar = 10.5, so UCLXbar = 10.8...View Answer
Unlock this answer now
Get Access to more Verified Answers free of charge
Correct Answer:
Verified
View Answer
Unlock this answer now
Get Access to more Verified Answers free of charge
Q43: An x-bar chart would be appropriate to
Q44: P-charts and c-charts are examples of control
Q45: The central limit theorem provides the statistical
Q46: Which of these patterns on a control
Q47: The mean of a process can be
Q49: A company is producing cylindrical blocks for
Q50: Technically, to achieve Six Sigma quality, there
Q51: A coffee dispenser is supposed to dispense
Q52: If we are tracking quality of performance
Q53: A computer software manufacturer has a toll-free