Multiple Choice
Table 14-6
The following data consists of a matrix of transition probabilities (P) of four majors in the College of Business, and the initial proportion of students in each major π(0) .Assume that each state represents a major and the transition probabilities represent changes from one major to the next after taking the introductory class in each discipline.
P =
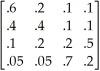
π(0) = (.4, .3, .2, .1)
-Using the data in Table 14-6, which major will end up with the greatest proportion of students?
A) Major 1
B) Major 2
C) Major 3
D) Major 4
Correct Answer:

Verified
Correct Answer:
Verified
Q35: The weather is becoming important to you
Q36: Markov analysis is a technique that deals
Q37: In a matrix of transition probabilities<br>A)the probabilities
Q38: In the long run, in Markov analysis<br>A)all
Q39: The copy machine in an office is
Q41: Which of the following is not an
Q42: Three fast food hamburger restaurants are competing
Q43: Table 14-4<br>Cuthbert Wylinghauser is a scheduler of
Q44: Markov analysis assumes that while a member
Q45: If we want to use Markov analysis