Multiple Choice
The following graph is a ________.
A) frequency polygon 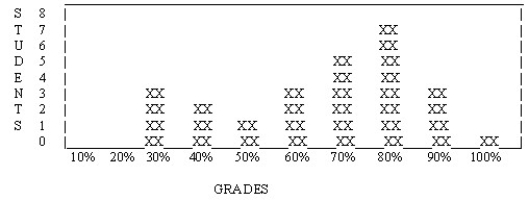
B) skewed distribution
C) frequency histogram
D) normal distribution
Correct Answer:

Verified
Correct Answer:
Verified
Related Questions
Q1: The mean of a set of numbers
Q2: There is a zero on a(n) _
Q23: For the set of numbers 2, 4,
Q55: If you know that the mean is
Q62: Today, psychologists reviewing the literature in a
Q67: The normal curve is _.<br>A) symmetrical<br>B) asymmetrical<br>C)
Q71: A student ranking various graduate schools on
Q90: A store owner wishes to determine which
Q92: Which of the following questions would be
Q94: After collecting all the research on gender