Multiple Choice
The following graph is a ________.
A) frequency polygon 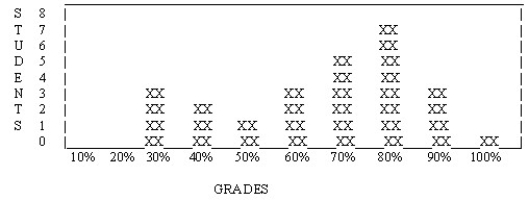
B) skewed distribution
C) frequency histogram
D) normal distribution
Correct Answer:

Verified
Correct Answer:
Verified
Related Questions
Q15: About _ percent of scores fall between
Q28: In the set of scores 90, 80,
Q29: Which of the following is true regarding
Q47: In a frequency histogram, the intervals are
Q68: The mean of a set of numbers
Q72: If you know that the median is
Q77: A branch of mathematics that psychologists use
Q81: A professor who classifies the students in
Q87: Categorizing people according to whether they voted
Q93: The following distribution is _. <img src="https://d2lvgg3v3hfg70.cloudfront.net/TB5083/.jpg"