Essay
The table below shows the level of GDP per capita in 1900 for four regions of the world, as well as their growth rates between 1900 and 1938. Plot this table to determine whether catch-up is likely to occur among these regions. Does growth theory explain the growth experience of these regions between 1900 and 1938? 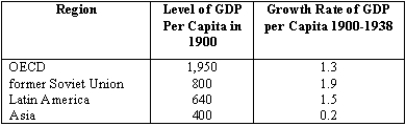
Correct Answer:

Verified
As the graph below shows, the growth exp...View Answer
Unlock this answer now
Get Access to more Verified Answers free of charge
Correct Answer:
Verified
View Answer
Unlock this answer now
Get Access to more Verified Answers free of charge
Q113: A major institution of the international monetary
Q114: Two important facts about economic growth to
Q115: The first of the United Nations Millennium
Q116: Which of the following was missing in
Q117: Which of the following is true about
Q119: For the most advanced countries, there is
Q120: Which of the following is a developing
Q121: One of the major purposes of the
Q122: What is the most important factor that
Q123: Karl Marx argued that the bourgeoisie inhibited