Essay
The table below shows the percentage difference between real and potential GDP and the rate of inflation for the years 1999 through 2003. If there were a presidential election in the year 2000, would these data support the view that there was a political business cycle during this period? 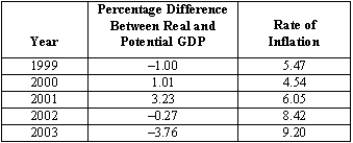
Correct Answer:

Verified
Yes. Notice that an expansion ...View Answer
Unlock this answer now
Get Access to more Verified Answers free of charge
Correct Answer:
Verified
View Answer
Unlock this answer now
Get Access to more Verified Answers free of charge
Q37: Explain how the facts justify the conclusion
Q38: The low unemployment rate in the late
Q39: Assuming everything else held constant, suppose there
Q40: In the past, the Fed has been
Q41: Central bank independence guarantees that there will
Q43: A constant money growth rule<br>A)leads to higher
Q44: The Fed's interest rate decisions depend on
Q45: How does the institutional setup of the
Q46: When the actual and target rate of
Q47: In an attempt to avert the worst