Multiple Choice
Exhibit 25-2 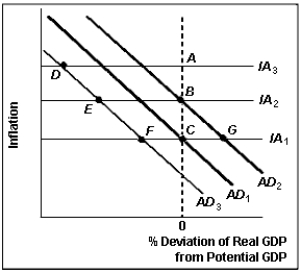
-According to Exhibit 25-2, which point best represents where the U.S. economy was in 2009?
A) A
B) E
C) C
D) D
E) F
Correct Answer:

Verified
Correct Answer:
Verified
Related Questions
Q107: If exports permanently decline, we would expect,
Q108: What is the difference between deflation and
Q109: Suppose that, at any given level of
Q110: Explain why the rate of inflation does
Q111: In the late 1960s and 1970s inflation
Q113: Price shocks are always accompanied by a
Q114: Suppose the central bank lowers its target
Q115: A price shock causes the AD curve
Q116: Disinflation most likely occurs when<br>A)output grows at
Q117: A supply shock is exactly the opposite