Essay
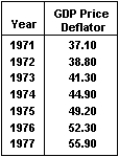
The figure below plots real and potential GDP between 1971 and 1977. Given the data in the corresponding table, can changes in the rate of inflation over this period be explained by the percent deviation between real and potential GDP? Do these data support or refute the validity of the assumptions about the IA line? 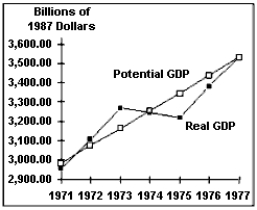
Correct Answer:

Verified
In 1972 and 1973, real GDP was above pot...View Answer
Unlock this answer now
Get Access to more Verified Answers free of charge
Correct Answer:
Verified
View Answer
Unlock this answer now
Get Access to more Verified Answers free of charge
Q167: If the central bank determines that aggregate
Q168: If the Fed aims to influence economic
Q169: The AD curve slopes upward because interest
Q170: If the economy is in a recession,
Q171: If real interest rates in the rest
Q173: Since changes in both monetary policy and
Q174: The Fed has direct control over the
Q175: Name three factors that cause the IA
Q176: If the economy is in a recession,
Q177: The text defines the monetary policy rule