Essay
Exhibit 23-4 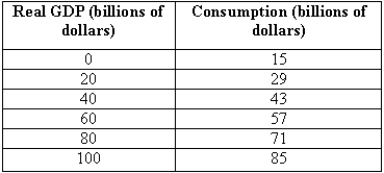
-Plot the consumption function based on the data in Exhibit 23-4. What is the marginal propensity to consume? If the marginal propensity to consume changes to 0.85, show what happens to the consumption function.
Correct Answer:

Verified
The relationship between consumption and...View Answer
Unlock this answer now
Get Access to more Verified Answers free of charge
Correct Answer:
Verified
View Answer
Unlock this answer now
Get Access to more Verified Answers free of charge
Q52: When the unemployment rate drops below the
Q53: Potential GDP growth is relatively smoother than
Q54: If capacity utilization is 98 percent,<br>A)the unemployment
Q55: When firms are at full capacity, real
Q56: When does the slope of the expenditure
Q58: Suppose in 2016, real GDP was $160
Q59: The relationship describing how consumption depends on
Q60: Along the 45-degree line,<br>A)spending equals income.<br>B)real GDP
Q61: Suppose that MPC = 0.5 and MPI
Q62: If there is an increase in government