Essay
The following table shows the relationship between income and consumption in an economy. 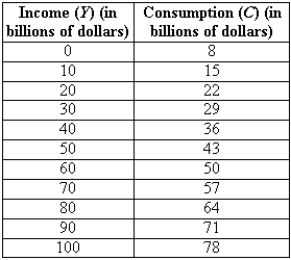 Assume that investment (I) is $5 billion, government purchases (G) are $4 billion, and net exports (X) are $1 billion.

Correct Answer:

Verified
Correct Answer:
Verified
Q109: Answer the questions below:<br> <img src="https://d2lvgg3v3hfg70.cloudfront.net/TB6906/.jpg" alt="Answer
Q110: Suppose consumption is $2,700 million when income
Q111: Exhibit 23-2 <img src="https://d2lvgg3v3hfg70.cloudfront.net/TB6906/.jpg" alt="Exhibit 23-2
Q112: Which of the following statements is false?<br>A)Economic
Q113: Suppose consumption increases by $250 million when
Q115: If the marginal propensity to consume increases,<br>A)firms
Q116: Which of the following best explains why
Q117: The consumption function describes<br>A)the negative relationship between
Q118: Why are most short-term forecasts based on
Q119: According to the permanent income model, the