Essay
Plot the following data for quantity of production and long-run average cost for a firm. Are there economies of scale, diseconomies of scale, or constant returns to scale? Indicate these areas in your diagram. 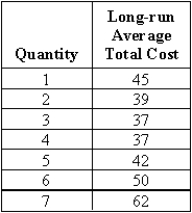
Correct Answer:

Verified
In the diagram, area A exhibit...View Answer
Unlock this answer now
Get Access to more Verified Answers free of charge
Correct Answer:
Verified
View Answer
Unlock this answer now
Get Access to more Verified Answers free of charge
Q3: The slope of the average fixed curve
Q4: In the short run, total cost is
Q5: The profit-maximizing decision in choosing the optimal
Q6: Exhibit 8-10 <img src="https://d2lvgg3v3hfg70.cloudfront.net/TB6906/.jpg" alt="Exhibit 8-10
Q7: Economies and diseconomies of scale are the
Q9: A merger between two firms producing different
Q10: Constant returns to scale occur when a
Q11: Average total cost, average variable cost, average
Q12: A firm can earn a loss even
Q13: If a profit-maximizing, competitive firm is producing