Solved
Exhibit 5-7 -The Market Demand Curve Represents the Utility Maximization Behavior of Maximization
True/False
Exhibit 5-7 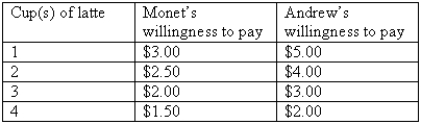
-The market demand curve represents the utility maximization behavior of a typical consumer.
Correct Answer:

Verified
Correct Answer:
Verified
Related Questions
Q9: To maximize utility, the amount that a
Q10: A change in the price of a
Q11: The budget constraint<br>A)is the combined price of
Q12: Marginal utility can be positive, zero, or
Q13: An individual's demand curve is not continuous
Q15: Exhibit 5-7 <img src="https://d2lvgg3v3hfg70.cloudfront.net/TB6906/.jpg" alt="Exhibit 5-7
Q16: Exhibit 5-5 <img src="https://d2lvgg3v3hfg70.cloudfront.net/TB6906/.jpg" alt="Exhibit 5-5
Q17: Exhibit 5-1 <img src="https://d2lvgg3v3hfg70.cloudfront.net/TB6906/.jpg" alt="Exhibit 5-1
Q18: To obtain utility, a consumer must<br>A)do unto
Q19: Why does an individual consume a good