Multiple Choice
Exhibit 2-1 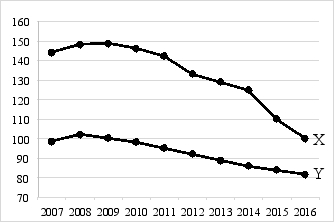
-Exhibit 2-1 shows movements of two variables, X and Y, from 2007 through 2016. From this diagram the most one can conclude is that
A) X and Y are positively correlated with each other.
B) X and Y are negatively correlated with each other.
C) X and Y are positively correlated with each other and either X causes Y or Y causes X.
D) we cannot say anything about how X and Y are related because we do not know the units of measurement for X and Y.
E) X and Y are not correlated with each other.
Correct Answer:

Verified
Correct Answer:
Verified
Q7: Consider a ratio for the total number
Q8: In describing the relationship between X and
Q9: Consider an economic model of tablet production,
Q10: Economists are likely to evaluate the impacts
Q11: A hypothesis is<br>A)an alternative to using models.<br>B)a
Q13: A two-dimensional graph cannot be used to
Q14: Exhibit 2A-5<br> <img src="https://d2lvgg3v3hfg70.cloudfront.net/TB6906/.jpg" alt="Exhibit 2A-5
Q15: A curve shows that every time family
Q16: Two variables are negatively correlated if<br>A)the value
Q17: All of the following are examples of