Multiple Choice
Exhibit 2-2 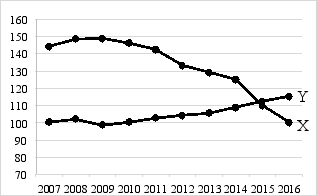
-Exhibit 2-2 shows the relationship between X and Y between 2007 and 2016. Suppose this correlation between X and Y continues to hold for the next 10 years. If Y declines over the period 2017 through 2020, we would expect
A) X to fall over the same period because X and Y are negatively correlated.
B) X to increase over the same period because X and Y are positively correlated.
C) X to increase over the same period because X and Y are negatively correlated.
D) the correlation to be unknown because we do not know the units of measurement for X and Y and thus cannot say anything about how X and Y are related.
E) X to fall over the same period because X and Y are positively correlated.
Correct Answer:

Verified
Correct Answer:
Verified
Q99: Exhibit 2A-4 <img src="https://d2lvgg3v3hfg70.cloudfront.net/TB6906/.jpg" alt="Exhibit 2A-4
Q100: A good explanation for why people believe
Q101: Using gasoline prices as an example, explain
Q102: Explain how the distinction between positive and
Q103: Economists develop new models only when new
Q105: Macroeconomics is concerned primarily with<br>A)the economy as
Q106: Exhibit 2-3<br> <img src="https://d2lvgg3v3hfg70.cloudfront.net/TB6906/.jpg" alt="Exhibit 2-3
Q107: An economic model is a tool used
Q108: Identify whether the following issues are macroeconomic
Q109: A positive statement is necessarily a subjective