Multiple Choice
Table 16-1 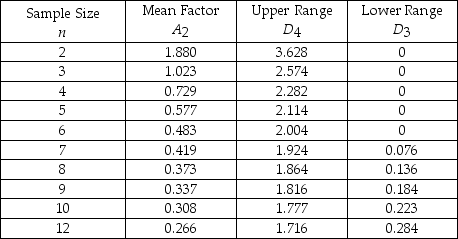
-Refer to Table 16-1. Bags of chocolate candy are sampled to ensure proper weight. The overall average for the samples is 36 ounces. Each sample contains twelve bags. The average range is 1.3 ounces. The upper control chart limit for the sample averages would be
A) 36.3458.
B) 35.6542.
C) 38.3101.
D) 36.6279.
E) 37.1258.
Correct Answer:

Verified
Correct Answer:
Verified
Q17: Table 15-2<br>Given the sample results (100 units
Q35: A p-chart has been developed for a
Q35: When receiving a shipment from a supplier,inspection
Q37: A coffee dispenser is supposed to dispense
Q48: If we wish to monitor the number
Q75: Table 15-2<br>Given the sample results (100 units
Q83: Defects in marble countertops usually require the
Q92: Variations that need not occur in production
Q95: The p-chart would be useful when we<br>A)took
Q96: Who introduced control charts in 1924?<br>A)W.Edwards Deming<br>B)Philip