Multiple Choice
Table 16-1 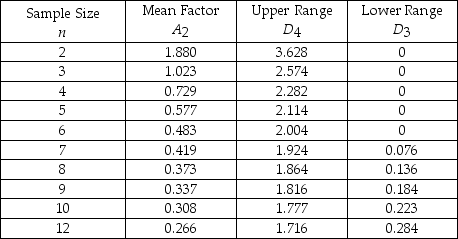
-Refer to Table 16-1. To guarantee that cans of soup are properly filled, some cans are sampled and the amounts measured. The overall average for the samples is 12 ounces. Each sample contains 10 cans. The average range is 0.4 ounces. The upper control chart limit for the sample averages would be
A) 12.1232.
B) 11.8768.
C) 13.2.
D) 12.308.
E) None of the above
Correct Answer:

Verified
Correct Answer:
Verified
Q1: Table 16-1 <img src="https://d2lvgg3v3hfg70.cloudfront.net/TB2951/.jpg" alt="Table 16-1
Q7: Match the following.<br>A) Control limits for an
Q8: Match the following.<br>A) Control limits for an
Q10: Table 16-2<br>Given the sample results (100 units
Q18: Variations that usually occur in a process
Q43: _ refers to a quality emphasis that
Q65: Which of the following is not a
Q70: Samples sizes of five are often used
Q72: A(n)_ chart is appropriate to monitor the
Q78: A local children's boutique specializes in formal