True/False
The following figure illustrates a utility curve for someone who is a risk seeker. 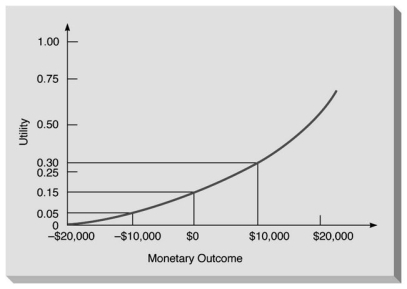
Correct Answer:

Verified
Correct Answer:
Verified
Related Questions
Q25: Barbour Electric is considering the introduction of
Q26: Any problem that can be presented in
Q28: Optimistic decision makers tend to<br>A)magnify favorable outcomes.<br>B)ignore
Q31: List the six steps in decision making.
Q41: The maximin decision criterion is used by
Q96: Nick has plans to open some pizza
Q97: The following payoff table provides profits based
Q101: Mark M. Upp has just been fired
Q102: The following is an opportunity loss table.
Q103: Consider the following payoff table. <img src="https://d2lvgg3v3hfg70.cloudfront.net/TB2951/.jpg"