menu-iconExamlexExamLexServices

Discover

Ask a Question
  1. All Topics
  2. Topic
    Biology
  3. Study Set
    Seeleys Anatomy Physiology
  4. Exam
    Exam 20: Cardiovascular System: the Heart
  5. Question
    -The Figure Illustrates the Cardiac Action Potential
Solved

-The Figure Illustrates the Cardiac Action Potential

Question 160

Question 160

Multiple Choice

  -The figure illustrates the cardiac action potential. What does  A  represent? A)  early repolarization phase B)  plateau phase C)  final repolarization phase D)  depolarization phase
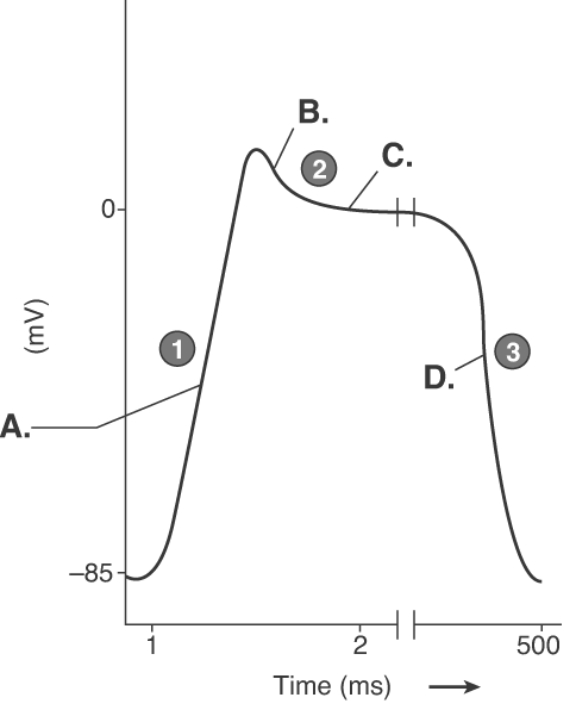
-The figure illustrates the cardiac action potential. What does "A" represent?


A) early repolarization phase
B) plateau phase
C) final repolarization phase
D) depolarization phase

Correct Answer:

verifed

Verified

Unlock this answer now
Get Access to more Verified Answers free of charge

Related Questions

Q27: The action potentials are slowed at the

Q50: Which of the following pairs is mismatched?<br>A)endocardium

Q79: The delivery of oxygen and nutrients to

Q95: Of the types of damage resulting from

Q121: Action potentials pass from one myocardial cell

Q158: Match the drug with its effects.<br>-anticoagulant<br>A)binds to

Q159: Use the following key to mark the

Q161: Use the following two choices:<br>-stimulation from vagus

Q162: <img src="https://d2lvgg3v3hfg70.cloudfront.net/TB6157/.jpg" alt=" -When blood passes

Q163: <img src="https://d2lvgg3v3hfg70.cloudfront.net/TB6157/.jpg" alt=" -Blood from the

Examlex

ExamLex

About UsContact UsPerks CenterHomeschoolingTest Prep

Work With Us

Campus RepresentativeInfluencers

Links

FaqPricingChrome Extension

Download The App

Get App StoreGet Google Play

Policies

Privacy PolicyTerms of ServiceHonor CodeCommunity Guidelines

Scan To Download

qr-code

Copyright © (2025) ExamLex LLC.

Privacy PolicyTerms Of ServiceHonor CodeCommunity Guidelines