Multiple Choice
The following graph is a ________. 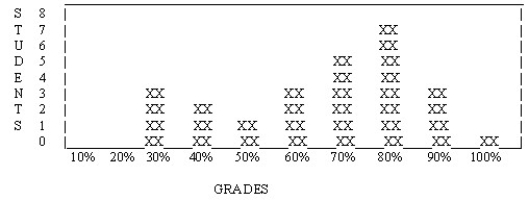
A) frequency polygon
B) skewed distribution
C) frequency histogram
D) normal distribution
Correct Answer:

Verified
Correct Answer:
Verified
Related Questions
Q91: About 68 percent of scores fall between
Q92: Which of the following questions would be
Q93: Each of the following is true except
Q94: After collecting all the research on gender
Q95: A professor who classifies the students in
Q96: We can say that one measurement is
Q97: The arithmetical average is also called the
Q99: For the numbers 17, 2, 9, 12,
Q100: In a set of survey results, the
Q101: The tendency of measurements to cluster around