Multiple Choice
Curve B below represents the oxygen-hemoglobin dissociation curve for normal body temperature, arterial hydrogen ion concentration, and DPG concentration. 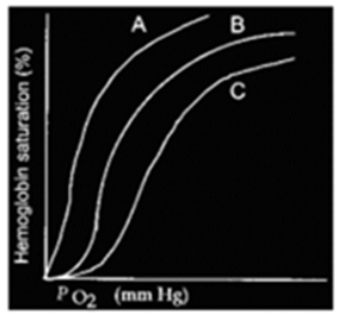
A) Curve A may represent the dissociation at higher than normal arterial H+ concentration.
B) Curve C may represent the dissociation at lower than normal body temperature.
C) Curve A may represent the dissociation at very low 2,3 diphosphoglycerate levels.
D) Curve C may represent the dissociation at lower than normal arterial H+ concentration.
E) Curve A may represent the dissociation at higher than normal body temperature.
Correct Answer:

Verified
Correct Answer:
Verified
Q4: Which of the following is most responsible
Q5: If all other factors remain the same,
Q6: Which of these causes inhalation/inspiration?<br>A) increase in
Q7: Which of the following are chemoreceptors?<br>A) hair
Q11: Which occurs as a result of hypoventilation?<br>A)
Q12: Which of the following is a
Q13: A decrease in arterial P<sub>O2</sub> stimulates increased
Q16: Emphysema is a disease characterized by low
Q20: Which of the following is NOT true
Q27: Which is normally TRUE about the intrapleural