Solved
Exhibit 19-1 -Refer to Exhibit 19-1.The Regression Line for the Combination of for the Combination
Multiple Choice
Exhibit 19-1
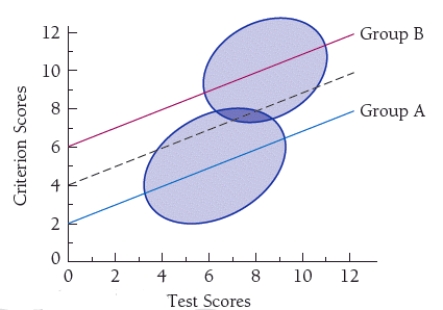
-Refer to Exhibit 19-1.The regression line for the combination of groups A and B in the above figure yields a predicted score of approximately ____ for a test score of 6.
A) 4.0
B) 5.5
C) 7.0
D) 8.5
Correct Answer:

Verified
Correct Answer:
Verified
Related Questions
Q11: An estimated learning potential is<br>A)a score on
Q26: _ attempts to identify items that are
Q35: The finding that intelligence scores have changed
Q36: Williams created the BITCH to test<br>A)the ability
Q45: The main type of validity evidence that
Q48: The SOMPA system<br>A)considers each child relative to
Q54: Examination of tests such as the WAIS
Q59: Which of the following is true of
Q61: Standardized tests have been accused of being
Q65: The assessment technique that best challenges traditional