Multiple Choice
Exhibit 19-1
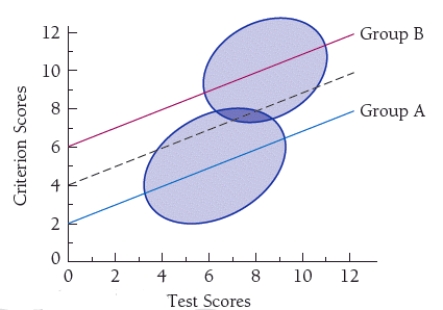
-Refer to Exhibit 19-1.The combined regression line in the figure ____ predicts Group A and ____ predicts Group B.
A) accurately;accurately
B) accurately;under
C) under;over
D) over;under
Correct Answer:

Verified
Correct Answer:
Verified
Related Questions
Q4: The textbook takes the position that observed
Q21: The SOMPA system uses portions of the<br>A)BITCH.<br>B)Chitling
Q24: Which SOMPA component uses the norms within
Q40: The BITCH is predominantly a test of<br>A)
Q41: The Equal Employment Opportunity Commission was created
Q47: Much of the controversy regarding testing has
Q49: Which viewpoint was not considered in the
Q53: The type of analysis that starts by
Q60: The Chitling test<br>A)has only been shown to
Q71: In one study on content bias in