Multiple Choice
Figure TB 11-1
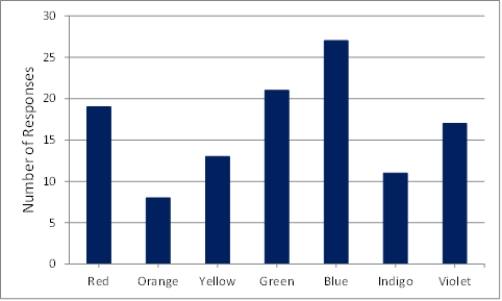
-What type of graph is shown in the accompanying figure?
A) bar chart
B) bivariate
C) pie
D) line
Correct Answer:

Verified
Correct Answer:
Verified
Related Questions
Q49: The _ is the most frequently appearing
Q50: Create a frequency distribution table for the
Q51: The _ is equal to the highest
Q52: Conclusion validity applies to quantitative but not
Q53: Tests to detect statistically significant differences are
Q55: Violation of the assumptions underlying statistical tests
Q56: Increasing the level of significance in order
Q57: The general term for the spread of
Q58: Statistical power is related to _.<br>A)Type I
Q59: A low strength signal is associated with