Essay
For the data below: 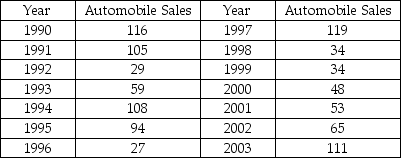 (a)Develop a scatter diagram.
(b)Develop a six-year moving average forecast.
(c)Find MAPE.
Correct Answer:

Verified
(a)scatter diagram  ...
...View Answer
Unlock this answer now
Get Access to more Verified Answers free of charge
Correct Answer:
Verified
(a)scatter diagram ...
View Answer
Unlock this answer now
Get Access to more Verified Answers free of charge
Related Questions
Q16: Multiple regression models use dummy variables to
Q24: Use simple exponential smoothing with α =
Q27: Assume that you have tried three different
Q29: A tracking signal was calculated for a
Q30: Which of the following is not a
Q31: For the data below: <img src="https://d2lvgg3v3hfg70.cloudfront.net/TB2950/.jpg" alt="For
Q32: A medium-term forecast typically covers a two-
Q33: Calculate (a)MAD, (b)MSE,and (c)MAPE for the following
Q52: Briefly describe why the scatter diagram is
Q114: List four components of TIME SERIES data.