True/False
The following figure illustrates a utility curve for someone who is a risk seeker. 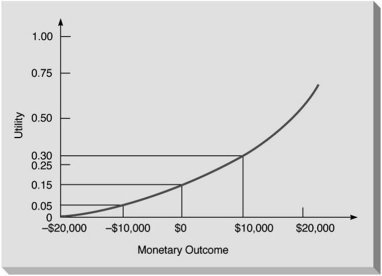
Correct Answer:

Verified
Correct Answer:
Verified
Related Questions
Q3: Nick has plans to open some pizza
Q6: Utilization of Bayes' theorem requires the use
Q8: Consider the following payoff table. <img src="https://d2lvgg3v3hfg70.cloudfront.net/TB2950/.jpg"
Q9: EVPI (expected value of perfect information)is a
Q10: A plant manager considers the operational cost
Q11: Which of the following is the fourth
Q29: A utility curve that shows utility increasing
Q50: Expected monetary value (EMV)is the average or
Q77: A second table (an opportunity loss table)must
Q78: Utility values typically range from -1 to