Multiple Choice
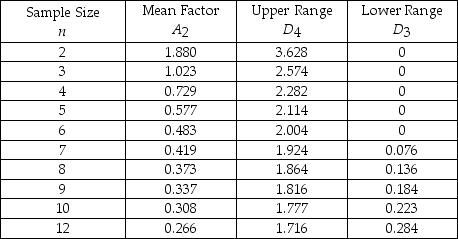
Table 15-1 
-Refer to Table 15-1.Bags of chocolate candy are sampled to ensure proper weight.The overall average for the samples is 36 ounces.Each sample contains twelve bags.The average range is 1.3 ounces.The upper control chart limit for the sample averages would be
A) 36.3458.
B) 35.6542.
C) 38.3101.
D) 36.6279.
E) 37.1258.
Correct Answer:

Verified
Correct Answer:
Verified
Q35: A p-chart has been developed for a
Q49: A company is producing cylindrical blocks for
Q65: Leo Phan is the new business manager
Q75: A computer diskette manufacturer is concerned that
Q84: Control charts that are used to monitor
Q87: The inspection of cans of juice involves
Q89: Table 15-1 <img src="https://d2lvgg3v3hfg70.cloudfront.net/TB2950/.jpg" alt="Table 15-1
Q90: Match the following.<br>-Column 1: D<sub>4</sub><br><sub> </sub> <img
Q92: Variations that need not occur in production
Q95: Assignable variations in a process are also