Multiple Choice
Table 15-1 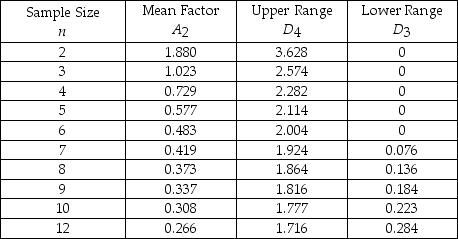
-Refer to Table 15-1.To guarantee that cans of soda are properly filled,some cans are sampled and the amounts measured.The overall average for the samples is 12 ounces.Each sample contains 10 cans.The average range is 0.4 ounces.The lower control chart limit for the sample averages would be
A) 12.1232.
B) 11.8768.
C) 13.2.
D) 12.308.
E) None of the above
Correct Answer:

Verified
Correct Answer:
Verified
Q8: It is impossible to develop a process
Q53: A computer software manufacturer has a toll-free
Q75: Table 15-2<br>Given the sample results (100 units
Q75: A computer diskette manufacturer is concerned that
Q76: For the problems which follow,match the following.<br>-Column
Q77: For the problems which follow,match the following.<br>-Column
Q78: When a process is in control,only _
Q79: Match the following.<br>-Column 1: <img src="https://d2lvgg3v3hfg70.cloudfront.net/TB2950/.jpg" alt="Match
Q84: Control charts that are used to monitor
Q95: Assignable variations in a process are also