Multiple Choice
Table 15-1 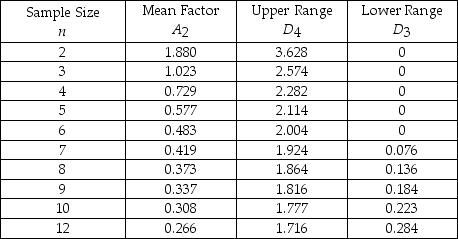
-Refer to Table 15-1.The average range of a process for packaging cereal is 1.1 ounces.If the sample size is 10,find the lower control chart limit for the range chart.
A) 0.245
B) 1.955
C) 1.777
D) 0.223
E) None of the above
Correct Answer:

Verified
Correct Answer:
Verified
Q35: When receiving a shipment from a supplier,inspection
Q36: The <img src="https://d2lvgg3v3hfg70.cloudfront.net/TB2950/.jpg" alt="The -chart
Q37: A coffee dispenser is supposed to dispense
Q38: Technically,to achieve Six Sigma quality,there would have
Q39: For the problems which follow,match the following.<br>-Column
Q41: The chart one might use to monitor
Q42: Bags of pretzels are sampled to ensure
Q43: _ refers to a quality emphasis that
Q44: A p-chart is based on which of
Q68: W.Edwards Deming introduced control charts in the