Multiple Choice
Table 15-2
Given the sample results (100 units in each sample) : 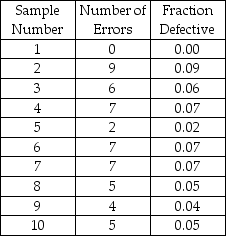
-The c-chart is useful when we
A) take a number of measurements and compute the average.
B) take a number of measurements and compute the ranges.
C) find the fraction of the production lot defective.
D) find the number of defective items in a production lot.
E) None of the above
Correct Answer:

Verified
Correct Answer:
Verified
Q7: Technically,to achieve Six Sigma quality,there would have
Q8: Defects in the finish of new,custom,automobiles usually
Q9: Table 15-1 <img src="https://d2lvgg3v3hfg70.cloudfront.net/TB2950/.jpg" alt="Table 15-1
Q10: Match the following.<br>-Column 1: <img src="https://d2lvgg3v3hfg70.cloudfront.net/TB2950/.jpg" alt="Match
Q13: A quality control program is being developed
Q16: R-charts measure changes in<br>A)central tendency.<br>B)degree of variation.<br>C)number
Q17: Table 15-2<br>Given the sample results (100 units
Q43: An x-bar chart would be appropriate to
Q70: Samples sizes of five are often used
Q73: A coffee company is attempting to make