Multiple Choice
Table 15-2
Given the sample results (100 units in each sample) : 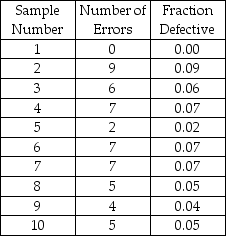
-A company has been receiving complaints about the attitude of some sales clerks.Over a 10-day period,the total number of complaints was 250.The company wishes to develop a control chart for the number of complaints.What would the lower control limit on the number of complaints per day be for a 3 sigma (99.7%) control chart?
A) 20
B) 0
C) 15
D) 10
E) 202.6
Correct Answer:

Verified
Correct Answer:
Verified
Q37: Explain the difference between a p-chart and
Q44: P-charts and c-charts are examples of control
Q52: If we are tracking quality of performance
Q65: Which of the following is not a
Q66: <img src="https://d2lvgg3v3hfg70.cloudfront.net/TB2950/.jpg" alt=" -charts indicate changes
Q68: For the problems which follow,match the following.<br>-Column
Q70: Table 15-2<br>Given the sample results (100 units
Q71: The U.S.government award for quality achievement is
Q72: A(n)_ chart is appropriate to monitor the
Q74: Natural variation of a production process that