Multiple Choice
Find the control limits for a p-chart using the below information: 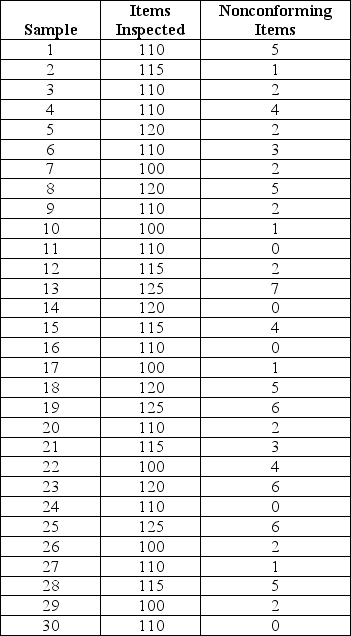
A) LCL = 0.019 and UCL = 0.069
B) LCL = 0 and UCL = 0.016
C) LCL = 0.004 and UCL = 0.20
D) LCL = 0 and UCL = 0.069
Correct Answer:

Verified
Correct Answer:
Verified
Related Questions
Q91: The special causes of variation _.<br>A)cannot be
Q92: The formula for finding the standard deviation
Q93: Find the control limits for the <img
Q94: A process is considered to be under
Q95: Which of the following is an example
Q97: If the sample sizes for attributes data
Q98: The formula for finding the standard deviation
Q99: What is the standard deviation if a
Q100: All of the following are important elements
Q101: For Tummy Tucker children's cereal,the lower specification