Short Answer
Use the table below to answer the following question(s).The table shows the crude oil prices in dollars per barrel,for 2007. 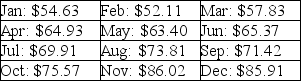
-Locate the median price of crude oil in 2007.
Correct Answer:

Verified
Correct Answer:
Verified
Related Questions
Q61: When a histogram is negatively skewed,it _.<br>A)is
Q62: Given that the standard deviation is equal
Q63: If the distribution of observations were perfectly
Q64: Sketch a positively skewed distribution.
Q65: The degree of asymmetry of observations around
Q67: Which of the following state(s)that for any
Q68: Sketch a perfectly symmetrical and unimodal distribution.
Q69: The _ is the middle value when
Q70: The degree of flatness or peakedness of
Q71: The _ is the observation that occurs