Multiple Choice
TABLE 18-3
A quality control analyst for a light bulb manufacturer is concerned that the time it takes to produce a batch of light bulbs is too erratic.Accordingly,the analyst randomly surveys 10 production periods each day for 14 days and records the sample mean and range for each day. 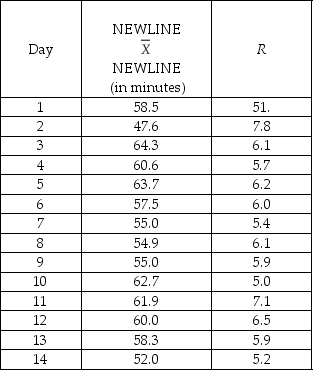
-Referring to Table 18-3,suppose the analyst constructs an R chart to see if the variability in production times is in-control.What is the upper control limit for this R chart?
A) 10.66
B) 9.37
C) 7.98
D) 6.34
Correct Answer:

Verified
Correct Answer:
Verified
Q11: TABLE 18-6<br>The maker of a packaged candy
Q11: True or False: Common causes of variation
Q12: True or False: The C<sub>pk</sub> is a
Q12: Determining the root causes of why defects
Q13: TABLE 18-5<br> A manufacturer of computer
Q13: TABLE 18-8<br>Recently,a university switched to a new
Q17: TABLE 18-4<br>A factory supervisor is concerned that
Q18: TABLE 18-4<br>A factory supervisor is concerned that
Q20: TABLE 18-3<br>A quality control analyst for a
Q38: True or False: The CPL and CPU