Multiple Choice
TABLE 18-3
A quality control analyst for a light bulb manufacturer is concerned that the time it takes to produce a batch of light bulbs is too erratic.Accordingly,the analyst randomly surveys 10 production periods each day for 14 days and records the sample mean and range for each day. 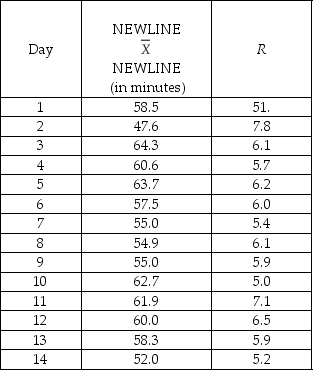
-Referring to Table 18-3,suppose the sample mean and range data were based on 11 observations per day instead of 10.How would this change affect the lower and upper control limits of the R chart?
A) LCL would increase; UCL would decrease.
B) LCL would remain the same; UCL would decrease.
C) Both LCL and UCL would remain the same.
D) LCL would decrease; UCL would increase.
Correct Answer:

Verified
Correct Answer:
Verified
Q9: True or False: One of the morals
Q25: TABLE 18-6 <br>The maker of
Q37: TABLE 18-7<br>A supplier of silicone sheets for
Q39: TABLE 18-10<br>Below is the number of defective
Q45: TABLE 18-9<br>The manufacturer of canned food constructed
Q46: TABLE 18-9<br>The manufacturer of canned food constructed
Q47: TABLE 18-9<br>The manufacturer of canned food constructed
Q67: TABLE 18-6 <br> The maker of
Q76: Which famous statistician developed the 14 Points
Q96: TABLE 18-7 <br> A supplier of