Short Answer
TABLE 18-9
The manufacturer of canned food constructed control charts and analyzed several quality characteristics.One characteristic of interest is the weight of the filled cans.The lower specification limit for weight is 2.95 pounds.The table below provides the range and mean of the weights of five cans tested every fifteen minutes during a day's production. 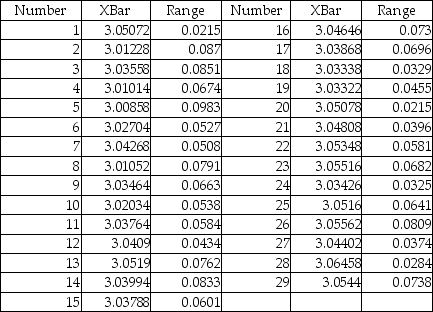
-Referring to Table 18-9,an R chart is to be constructed for the weight.One way to create the lower control limit involves multiplying the mean of the sample ranges by D3.For this data set,the value of D3 is ________.
Correct Answer:

Verified
Correct Answer:
Verified
Q38: TABLE 18-8 <br>Recently, a university switched
Q105: Referring to Table 18-6, a p control
Q110: TABLE 18-1<br>A local newspaper has 10 delivery
Q111: TABLE 18-5<br>A manufacturer of computer disks took
Q113: TABLE 18-8<br>Recently,a university switched to a new
Q117: TABLE 18-8<br>Recently,a university switched to a new
Q118: TABLE 18-7<br>A supplier of silicone sheets for
Q119: TABLE 18-7<br>A supplier of silicone sheets for
Q125: Which of the following situations suggests a
Q139: Variation due to the inherent variability in