Multiple Choice
TABLE 17-1
A real estate builder wishes to determine how house size (House) is influenced by family income (Income) ,family size (Size) ,and education of the head of household (School) .House size is measured in hundreds of square feet,income is measured in thousands of dollars,and education is in years.The builder randomly selected 50 families and ran the multiple regression.Microsoft Excel output is provided below: 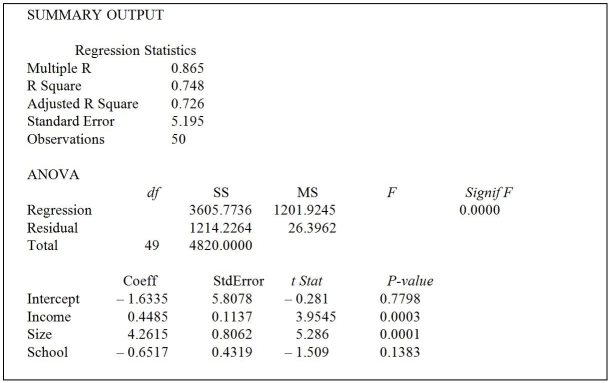
-Referring to Table 17-1,when the builder used a simple linear regression model with house size (House) as the dependent variable and education (School) as the independent variable,he obtained an r2 value of 23.0%.What additional percentage of the total variation in house size has been explained by including family size and income in the multiple regression?
A) 2.8%
B) 51.8%
C) 72.6%
D) 74.8%
Correct Answer:

Verified
Correct Answer:
Verified
Q2: Are Japanese managers more motivated than American
Q4: Data on the amount of money made
Q7: Data on the amount of money made
Q13: True or False: Every spring semester, the
Q85: TABLE 17-12<br>The marketing manager for a nationally
Q87: TABLE 17-10<br>Given below are results from the
Q88: TABLE 17-12<br>The marketing manager for a nationally
Q89: TABLE 17-2<br>One of the most common questions
Q90: TABLE 17-8<br>The superintendent of a school district
Q91: TABLE 17-12<br>The marketing manager for a nationally