Short Answer
TABLE 16-13
Given below is the monthly time-series data for U.S.retail sales of building materials over a specific year. 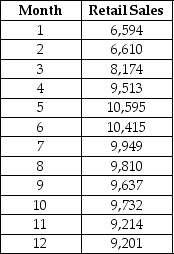 The results of the linear trend,quadratic trend,exponential trend,first-order autoregressive,second-order autoregressive and third-order autoregressive model are presented below in which the coded month for the 1st month is 0:
Linear trend model: 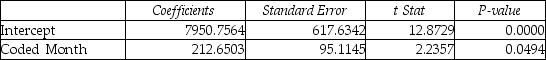 Quadratic trend model:
 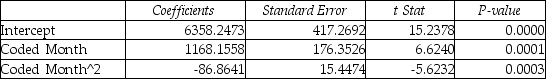 Exponential trend model:
 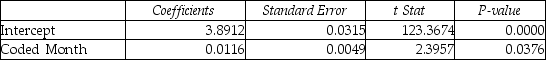 First-order autoregressive:
 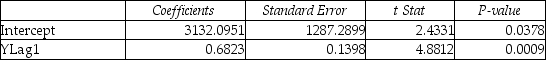 Second-order autoregressive:
 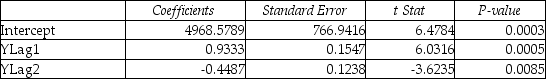 Third-order autoregressive:
 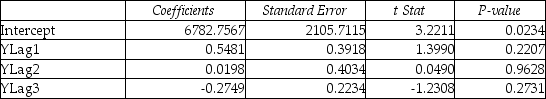 Below is the residual plot of the various models:
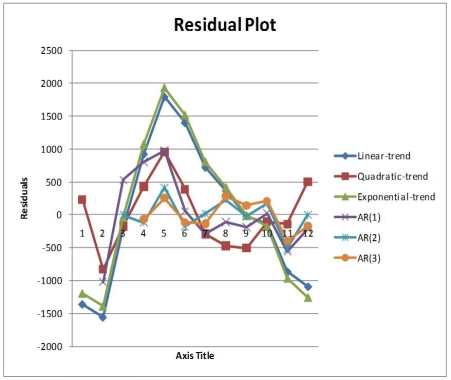
-Referring to Table 16-13,what is the exponentially smoothed forecast for the 13th month using a smoothing coefficient of W = 0.25 if the exponentially smooth value for the 10th and 11th month are 9,477.7776 and 9,411.8332,respectively?
Correct Answer:

Verified
Correct Answer:
Verified
Q26: TABLE 16-4<br>The number of cases of merlot
Q35: The annual multiplicative time-series model does not
Q117: TABLE 16-10<br>Business closures in Laramie, Wyoming from
Q129: TABLE 16-3<br>The following table contains the number
Q144: TABLE 16-4<br>The number of cases of merlot
Q145: TABLE 16-3<br>The following table contains the number
Q150: TABLE 16-9<br>Given below are EXCEL outputs for
Q151: TABLE 16-13<br>Given below is the monthly time-series
Q161: TABLE 16-5<br>The number of passengers arriving at
Q164: The cyclical component of a time series<br>A)represents