True/False
TABLE 16-13
Given below is the monthly time-series data for U.S.retail sales of building materials over a specific year. 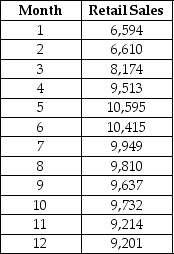 The results of the linear trend,quadratic trend,exponential trend,first-order autoregressive,second-order autoregressive and third-order autoregressive model are presented below in which the coded month for the 1st month is 0:
Linear trend model: 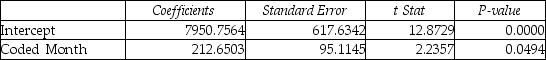 Quadratic trend model:
 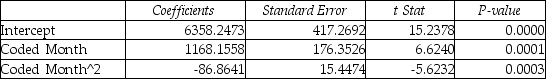 Exponential trend model:
 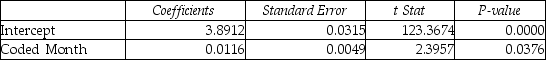 First-order autoregressive:
 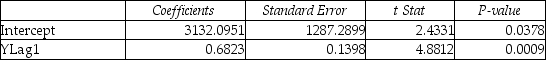 Second-order autoregressive:
 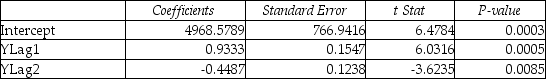 Third-order autoregressive:
 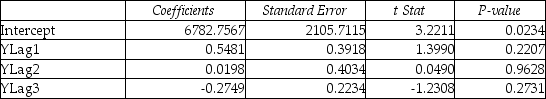 Below is the residual plot of the various models:
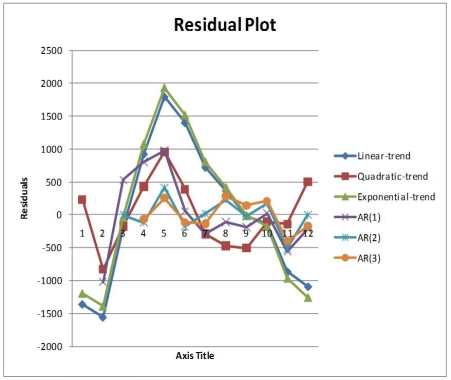
-True or False: Referring to Table 16-13,the best model based on the residual plots is the exponential-trend regression model.
Correct Answer:

Verified
Correct Answer:
Verified
Q8: TABLE 16-13<br>Given below is the monthly time-series
Q26: TABLE 16-4<br>The number of cases of merlot
Q98: TABLE 16-13<br>Given below is the monthly time-series
Q137: TABLE 16-12<br>A local store developed a multiplicative
Q139: TABLE 16-13<br>Given below is the monthly time-series
Q144: TABLE 16-4<br>The number of cases of merlot
Q145: TABLE 16-3<br>The following table contains the number
Q151: TABLE 16-13<br>Given below is the monthly time-series
Q158: TABLE 16-5<br>The number of passengers arriving at
Q166: TABLE 16-13<br>Given below is the monthly time-series