Multiple Choice
TABLE 14-6
One of the most common questions of prospective house buyers pertains to the cost of heating in dollars (Y) .To provide its customers with information on that matter,a large real estate firm used the following 2 variables to predict heating costs: the daily minimum outside temperature in degrees of Fahrenheit (X1) and the amount of insulation in inches (X2) .Given below is EXCEL output of the regression model. 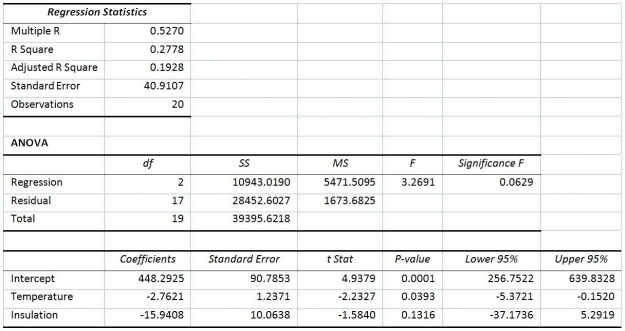 Also SSR (X1 ∣ X2) = 8343.3572 and SSR (X2 ∣ X1) = 4199.2672
-Referring to Table 14-6,what can we say about the regression model?
A) The model explains 17.12% of the variability of heating costs; after correcting for the degrees of freedom,the model explains 27.78% of the sample variability of heating costs.
B) The model explains 19.28% of the variability of heating costs; after correcting for the degrees of freedom,the model explains 27.78% of the sample variability of heating costs.
C) The model explains 27.78% of the variability of heating costs; after correcting for the degrees of freedom,the model explains 19.28% of the sample variability of heating costs.
D) The model explains 19.28% of the variability of heating costs; after correcting for the degrees of freedom,the model explains 17.12% of the sample variability of heating costs.
Correct Answer:

Verified
Correct Answer:
Verified
Q27: True or False: When an explanatory variable
Q28: True or False: You have just computed
Q91: TABLE 14-13<br>An econometrician is interested in evaluating
Q140: TABLE 14-5<br>A microeconomist wants to determine how
Q160: TABLE 14-19<br>The marketing manager for a nationally
Q162: TABLE 14-17<br>Given below are results from the
Q166: TABLE 14-4<br>A real estate builder wishes to
Q168: TABLE 14-16<br>What are the factors that determine
Q181: TABLE 14-7<br>The department head of the accounting
Q343: TABLE 14-3<br>An economist is interested to see