Short Answer
TABLE 14-8
A financial analyst wanted to examine the relationship between salary (in $1,000)and 2 variables: age
(X1 = Age)and experience in the field (X2 = Exper).He took a sample of 20 employees and obtained the following Microsoft Excel output: 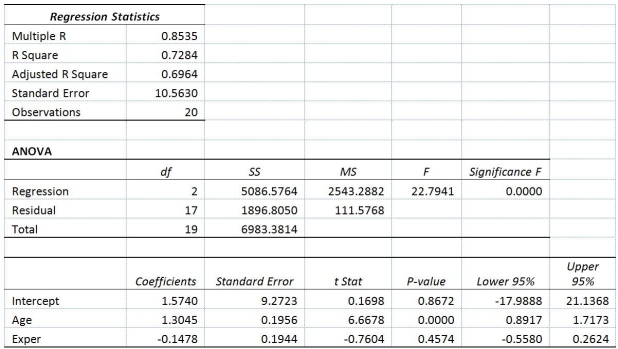 Also,the sum of squares due to the regression for the model that includes only Age is 5022.0654 while the sum of squares due to the regression for the model that includes only Exper is 125.9848.
-Referring to Table 14-8,________% of the variation in salary can be explained by the variation in age while holding experience constant.
Correct Answer:

Verified
Correct Answer:
Verified
Q97: TABLE 14-2<br>A professor of industrial relations believes
Q179: TABLE 14-3<br>An economist is interested to see
Q212: TABLE 14-1<br>A manager of a product sales
Q251: TABLE 14-15<br>The superintendent of a school district
Q294: TABLE 14-12<br>As a project for his business
Q295: TABLE 14-19<br>The marketing manager for a nationally
Q298: TABLE 14-4<br>A real estate builder wishes to
Q301: TABLE 14-15<br>The superintendent of a school district
Q304: TABLE 14-18<br>A logistic regression model was estimated
Q331: TABLE 14-13<br>An econometrician is interested in evaluating