Multiple Choice
TABLE 14-15
The superintendent of a school district wanted to predict the percentage of students passing a sixth-grade proficiency test.She obtained the data on percentage of students passing the proficiency test (% Passing) ,mean teacher salary in thousands of dollars (Salaries) ,and instructional spending per pupil in thousands of dollars (Spending) of 47 schools in the state.
Following is the multiple regression output with Y = % Passing as the dependent variable,X1 = Salaries and X2 = Spending: 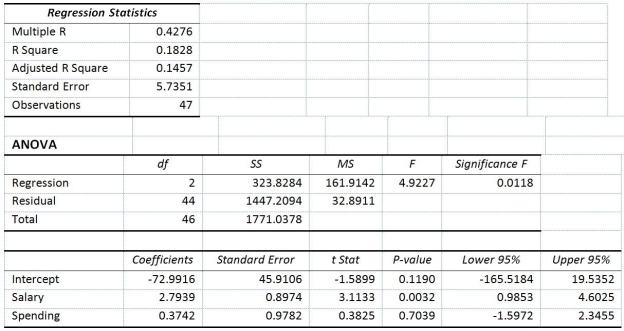
-Referring to Table 14-15,which of the following is a correct statement?
A) 18.26% of the total variation in the percentage of students passing the proficiency test can be explained by mean teacher salary and instructional spending per pupil.
B) 18.26% of the total variation in the percentage of students passing the proficiency test can be explained by mean teacher salary and instructional spending per pupil after adjusting for the number of predictors and sample size.
C) 18.26% of the total variation in the percentage of students passing the proficiency test can be explained by mean teacher salary holding constant the effect of instructional spending per pupil.
D) 18.26% of the total variation in the percentage of students passing the proficiency test can be explained by instructional spending per pupil holding constant the effect of mean teacher salary.
Correct Answer:

Verified
Correct Answer:
Verified
Q202: If a categorical independent variable contains 2
Q276: TABLE 14-15<br>The superintendent of a school district
Q277: TABLE 14-4<br>A real estate builder wishes to
Q278: TABLE 14-19<br>The marketing manager for a nationally
Q279: TABLE 14-17<br>Given below are results from the
Q280: TABLE 14-17<br>Given below are results from the
Q283: TABLE 14-8<br>A financial analyst wanted to examine
Q284: TABLE 14-6<br>One of the most common questions
Q285: TABLE 14-7<br>The department head of the accounting
Q286: TABLE 14-15<br>The superintendent of a school district